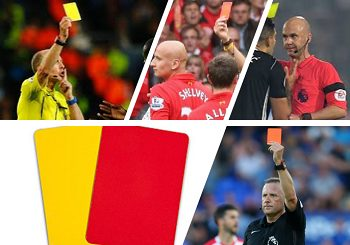
The 2011/2012 English Premier League campaign is widely analyzed for its hyper-volatile scorelines, but the underlying engine behind many of these high-scoring outcomes was an unprecedented distribution of penalty kicks. Unlike field goals, which rely on sustained possession or collective attacking sequences, penalty awards represent isolated tactical failures or successes inside the eighteen-yard box. For sports bettors constructing predictive models, understanding why certain teams became statistical magnets for penalty awards or concessions during this specific season provides deep macroeconomic insights into how technical disparities and tactical setups translate into high-value refereeing decisions.
Why Penalty Distribution Defied Standard Possession Metrics
Traditional predictive algorithms frequently assume that a direct correlation exists between high ball possession and the number of penalties a team wins over a 38-game season. The logical premise is that the more time a team spends inside the opposition’s penalty area, the higher the mathematical probability of drawing a foul from a fatigued defender. However, the 2011/12 data proved that this relationship is non-linear, as several possession-dominant teams struggled to win spot-kicks, while direct, counter-attacking sides excelled at forcing defenders into catastrophic, low-probability tackles.
This asymmetry indicates that tactical profile—specifically the speed of attacking transition and the frequency of individual dribbling inside the box—is far more predictive than raw territory ownership. When a defensive unit is forced to drop deep and turn back toward its own goal at high velocities, the physical mechanics of tackling become highly erratic. Bettors who rely solely on team quality metrics frequently miss these micro-tactical variables, leading to a severe mispricing of the “Penalty to be Awarded” sub-markets.
Mapping the Systemic Disparities Across the Capital and the North
Evaluating the hard data from this historic season reveals an extreme divergence between clubs that manipulated defensive lines effectively and those whose defensive shapes routinely collapsed under pressure. Certain teams developed an active statistical bias toward spot-kick involvement, altering the baseline expectations for matchday officiating. The table below isolates the key outliers that dominated the penalty metrics during this volatile campaign.
| Football Club | Penalties Awarded (For) | Penalties Conceded (Against) | Net Penalty Differential | Individual Penalty Conversion Rate |
| Manchester City | 8 | 4 | +4 | 87.5% |
| Manchester United | 11 | 5 | +6 | 72.7% |
| Chelsea | 5 | 5 | 0 | 100.0% |
| Blackburn Rovers | 7 | 10 | -3 | 57.1% |
| Wigan Athletic | 4 | 8 | -4 | 75.0% |
Analyzing this specific allocation demonstrates that Manchester United’s aggressive wide play and direct vertical passes into the penalty area created a highly volatile defensive environment for opponents, yielding a league-high eleven penalties. Conversely, Blackburn Rovers showcased a catastrophic defensive profile, conceding ten spot-kicks due to their systemic inability to manage low-cross situations without committing physical infractions. For sports analysts, this distribution emphasizes that targeting teams with highly negative net differentials offers an incredibly reliable baseline for tracking alternative in-play wagering options.
The Biomechanical Triggers Behind Blackburn’s Defensive Failures
To understand why a team like Blackburn Rovers conceded penalties at such an alarming frequency, one must examine the specific mechanics of their defensive organization. Rather than maintaining a proactive, high-line containment strategy, their back four consistently retreated deep into their own penalty box, which reduced the physical distance between the attacker and the goalkeeper.
When defensive lines operate under deep territorial restriction, any misjudged block or lunging tackle carries a massive risk of contacting the attacker instead of the ball. Furthermore, operating in close proximity to the goal increases the likelihood of handballs, as defenders instinctively throw their bodies into firing lanes to compensate for structural spacing errors. This cause-and-effect loop proves that deep, passive defensive units are mathematically predisposed to conceding spot-kicks, regardless of the individual quality of their personnel.
Exploiting Direct Attacking Profiles in Modern Betting Models
Recognizing the tactical blueprints that drove the 2011/12 penalty surge allows modern market participants to identify similar pricing inefficiencies in contemporary league structures. Bookmakers frequently price the probability of a penalty based on historical league-wide averages, meaning that matches involving teams with highly specific direct-dribbling metrics are systematically undervalued.
The Correlation Between High-Velocity Dribblers and Spot-Kicks
Teams that possess elite, isolated wingers who look to beat their marker inside the penalty box rather than crossing from deep positions place immense stress on an opponent’s physical discipline. When a defender is isolated in a one-on-one scenario with a high-acceleration attacker, the probability of a mistimed tackle escalates significantly, creating an ideal scenario for backing penalty outcomes.
Midfield Transition Overload and Delayed Recovery Runs
When a midfield unit fails to disrupt an opponent’s counter-attack in the central third of the pitch, the central defenders are forced to step up and challenge attackers at full sprint. This delayed recovery tracking frequently results in fouls committed just inside the eighteen-yard boundary line, as retreating defenders lack the deceleration control required to make a clean tackle.
Maximizing Value Through Live Penalty Line Adjustments
In-play football betting requires a comprehensive understanding of how match state affects the likelihood of a referee pointing to the penalty spot. As game weeks progress and teams find themselves chasing critical points, the physical intensity of matches shifts dramatically, altering the operational thresholds of the officiating crew. Observing a trailing team flood the opposition penalty area with aerial targets during the final twenty minutes provides an actionable signal that the probability of a defensive infraction has peaked. Should an analytical bettor observe these precise situational triggers aligning during a live fixture, executing wagers through a highly responsive online betting site managed under the technical infrastructure of ufabet168 member ensures optimal access to fluidly updating prop-market selections before the line loses its inherent mathematical edge.
Statistical Degradation: When Penalty Trends Fail to Materialize
While tracking penalty frequencies yields highly profitable insights, an expert analyst must isolate the specific constraints that cause these statistical trends to break down entirely. A common failure case occurs when a highly aggressive, penalty-prone squad encounters a referee who utilizes an exceptionally high threshold for calling physical contact inside the box.
- Officiating crews with a documented history of dismissing soft penalty appeals to maintain match flow.
- Inclement weather conditions that restrict high-velocity dribbling and force teams into long-range shooting profiles.
- Tactical adaptations where a struggling defensive unit switches to a five-man backline to completely eliminate one-on-one isolation spaces.
When these mitigating environmental or structural factors are present, the historical probability of a penalty occurring drops significantly. For instance, during the 2011/12 campaign, certain highly anticipated, high-stress matchups resulted in zero spot-kicks simply because the managers adjusted their defensive depth to prioritize blocking crosses before they could enter the eighteen-yard perimeter, entirely neutralizing the threat of isolation fouls.
Aligning Alternative Market Liquidity with Analytical Findings
For experienced sports bettors, the ultimate objective of isolating these historic penalty distributions is to diversify risk away from hyper-efficient mainstream lines. When the Asian Handicap or Match Odds markets offer minimal value due to heavy public balancing, shifting capital toward alternative statistical props provides a distinct operational advantage.
Assuming an analyst identifies a fixture where a deep-lying defensive block faces a high-velocity transitional attack, utilizing a diverse betting interface via a premium casino online website guarantees access to the specialized prop-markets, such as exact penalty distributions, player-to-be-carded lines, and live referee tracking variables necessary to fully exploit the underlying data.
Summary
The 2011/2012 Premier League season demonstrates that penalty distributions are driven by specific tactical profiles and mechanical defensive errors rather than basic possession percentages. Direct vertical attacks and high-velocity dribbling inside the eighteen-yard box consistently force deep-lying, passive defensive units into high-risk, panic-driven challenges that yield a significant volume of spot-kicks. By assessing referee tendencies, tracking the physical mechanics of defensive recovery runs, and accounting for situational anomalies that suppress foul frequencies, sports bettors can successfully identify and exploit massive pricing blind spots across modern football sub-markets.